Visualizing Workflows
ant-ai can render any Workflow as a diagram. Nodes appear as rectangles, START and END as ellipses, and conditional edges as diamond decision nodes with dashed outgoing arrows to each possible destination.
Installation
The visualizer wraps the Graphviz library. Install both the Python package and the system CLI:
uv add ant-ai[viz]

# macOS
brew install graphviz

# Ubuntu / Debian
sudo apt-get install graphviz
Jupyter notebook
Call build_workflow_graph() and make it the last expression in a cell — the returned Digraph object renders inline via its _repr_svg_() method:
from ant_ai.workflow import build_workflow_graph

build_workflow_graph(wf)
Export to file
render_workflow() writes the diagram to disk and returns the output path.
from ant_ai.workflow import render_workflow

# Raster / vector
render_workflow(wf, "diagram", format="png")
render_workflow(wf, "diagram", format="svg")
render_workflow(wf, "diagram", format="pdf")

# LaTeX — produces a self-contained .tex file with a tikzpicture
render_workflow(wf, "diagram", format="latex")
LaTeX output
The latex format generates a standalone diagram.tex compilable with pdflatex:
\documentclass{standalone}
\usepackage{tikz}
\usetikzlibrary{shapes.geometric, arrows.meta, positioning}
\begin{document}
\begin{tikzpicture}[
  every node/.style={font=\small},
]
  ...
\end{tikzpicture}
\end{document}
To embed it in an existing document, copy the tikzpicture block or use \input{diagram.tex} with an appropriate preamble.
Layout direction
The default layout is left-to-right (rankdir="LR"). Pass rankdir="TB" for a top-to-bottom layout instead:
build_workflow_graph(wf)                          # left-to-right (default)
render_workflow(wf, "diagram", format="png")      # left-to-right (default)
render_workflow(wf, "diagram", format="png", rankdir="TB")  # top-to-bottom
How conditional edges are resolved
The visualizer inspects the router function's source code with Python's ast module and collects every literal string in a return statement. Each one becomes a dashed outgoing edge from the decision diamond:
def my_router(agent, state, ctx) -> Literal["validate", "publish"]:
    if state.last_message.content == "retry":
        return "validate"   # ← edge 1
    return "publish"        # ← edge 2
Variable returns (e.g. return node_name) are not collected — use string literals in router functions.
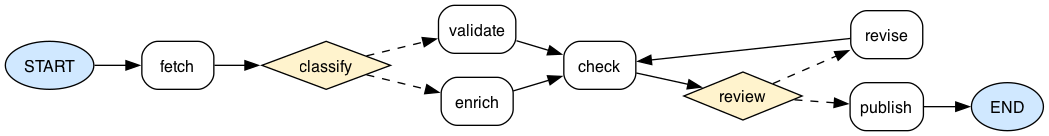
Example
The diagram below is produced by the following workflow:
from typing import Literal
from ant_ai.workflow import Workflow, render_workflow
from ant_ai.workflow.workflow import START, END

w = Workflow()

async def noop(agent, state, ctx): ...

for node in ("fetch", "enrich", "validate", "check", "publish", "revise"):
    w.add_node(node, noop)

def classify(agent, state, ctx) -> Literal["enrich", "validate"]:
    if state.last_message.content == "enrich":
        return "enrich"
    return "validate"

def review(agent, state, ctx) -> Literal["publish", "revise"]:
    if state.last_message.content == "approved":
        return "publish"
    return "revise"

w.add_edge(START, "fetch")
w.add_conditional_edge("fetch", classify)   # → enrich or validate
w.add_edge("validate", "check")
w.add_edge("enrich", "check")
w.add_conditional_edge("check", review)    # → publish or revise
w.add_edge("revise", "check")              # retry loop
w.add_edge("publish", END)

render_workflow(w, "diagram", format="png")
The resulting diagram looks like this: